Jun 26th, 2024 by
Lekshmy R S
In the vast landscape of data, visualization acts as a powerful guide—one that illuminates patterns, relationships, and hidden stories. It transforms raw numbers, abstract concepts, and complex structures into visual representations that our brains can grasp effortlessly. By converting intricate datasets into intuitive graphics, visualization not only enhances our understanding but also aids in decision-making processes, uncovers insights that might otherwise remain obscured, and fosters communication of complex ideas with clarity and precision. Through the use of colors, shapes, and interactive elements, data visualization bridges the gap between quantitative analysis and qualitative comprehension, enabling us to explore the depths of information with both curiosity and confidence.
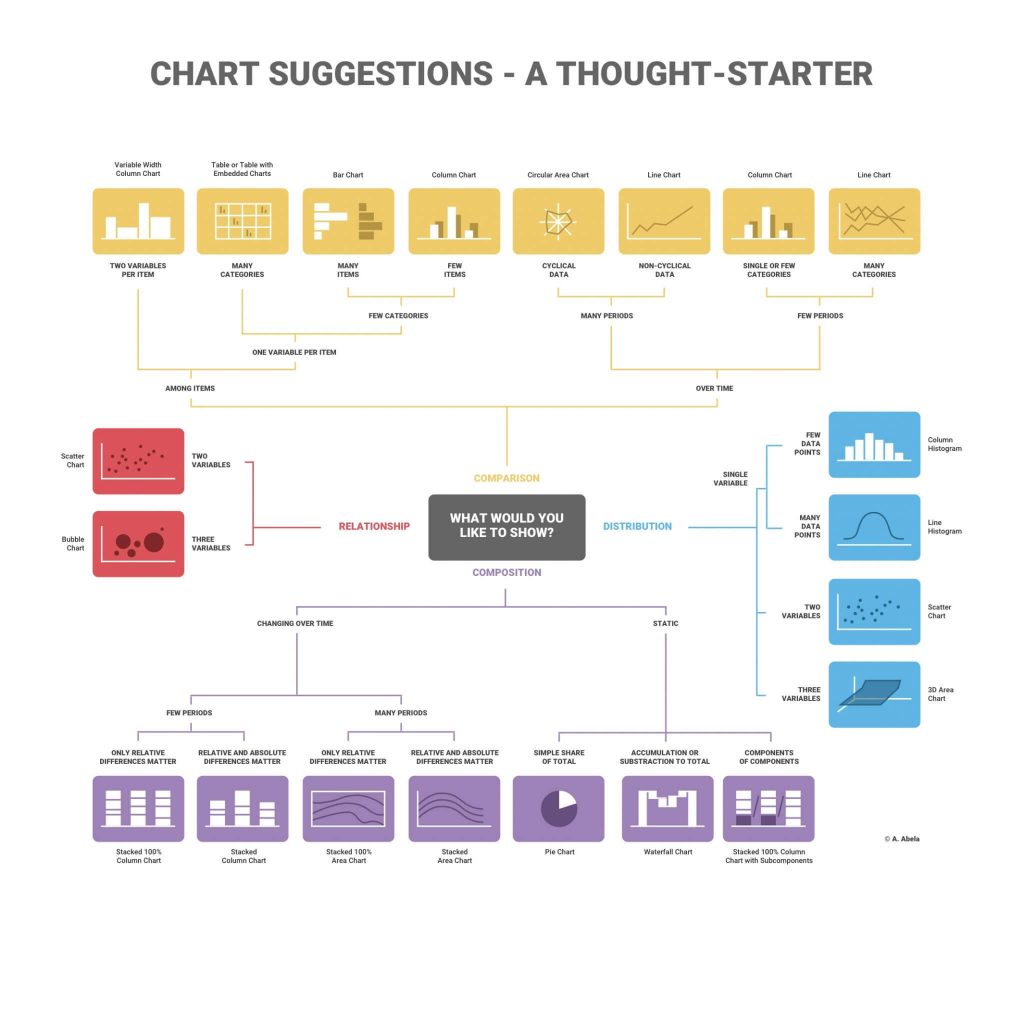
Choosing the right type of chart for your data is crucial because it significantly impacts how effectively you can communicate information to your audience. By selecting the appropriate chart, you can make your data-driven ideas stand out and ensure clarity in your message. This is why data visualization tools and methods are often used in business, financial analysis, project management, and scientific studies.
When considering the plethora of data at your disposal, selecting a chart type that aligns with your objectives and effectively conveys the message you want to communicate is essential. Here’s why the choice of chart matters:
Showing Change Over Time: Line charts are ideal for illustrating trends and changes over time, making them invaluable in tracking progress or identifying patterns.
Representing Part-to-Whole Composition: Pie charts provide a clear visual representation of how individual parts contribute to the whole, aiding in understanding proportions and percentages.
Analysing Data Distribution: Histograms and box plots are effective for visualizing data distribution, helping to identify central tendencies, variations, and outliers.
Comparing Values Between Groups: Bar charts and column charts excel at comparing values across different categories or groups, allowing for easy comparisons and trend identification.
Observing Relationships Between Variables: Scatter plots are excellent for revealing relationships and correlations between two variables, offering insights into patterns and dependencies.
Visualizing Geographical Data: Maps and choropleth maps are indispensable for displaying spatial data, enabling geographic patterns and trends to be easily identified and understood.

Comparison charts are used to compare one or more datasets. They can compare items or show differences over time. These visual aids are valuable tools for gaining insights into patterns, trends, and variations within the data sets, facilitating a comprehensive understanding of the information at hand.
Bar and column charts are used to compare different items. Both charts compare two or more values.
|
Dual axis charts are a type of visualization that combines two different types of charts in a single graph.
|
A line chart reveals trends or changes over time.
|
Composition charts are used to display parts of a whole and change over time. These charts provide a visual representation of how different components contribute to the overall composition and how their proportions evolve over a specified period.
Pie charts are used to show parts of a whole. A pie chart represents numbers in percentages, and the total sum of all the divided segments equals 100 percent.
|
It is used to see the magnitude of the values, it can show both change over time, overall trends, and continuity across a dataset.
|
The treemap functions as a visualization composed of nested rectangles.
|
Stacked bar chart is better for cumulative values including displaying multiple levels of the same variable.
|
Relationship charts are used to show a connection or correlation between two or more variables. By visually representing the interdependencies and associations, relationship charts provide a clear and concise way to comprehend the intricate dynamics between the variables being examined.
Scatter Plots are used when you’re looking for relationships between numerical variables, and are often accompanied by a trend line to help show correlations.
|
When you have 3 numerical variables that should be plotted on three independent axes (x-, y- and z-axes), bubble chart makes this possible.
|
Distribution charts are used to show how variables are distributed over time, helping identify outliers and trends. By illustrating the spread and pattern of data points, distribution charts enable analysts to discern patterns, anomalies, and the overall shape of the data distribution.
It is used to graphing the frequency over a distribution.
|
Box plot will provide high-level information at a glance, offering general information about a group of data’s symmetry, skew, variance, and outliers.
|
Choosing the right chart depends on the variables and goals. While there are general guidelines, trying different chart types and encoding methods may reveal more information. You can use more than one plot to keep things clear and make comparisons between variables. In conclusion, by selecting the appropriate chart, you can make your data-driven ideas stand out and ensure clarity in your message. The right choice enhances data communication, aids understanding, and ensures accuracy in conveying your message. Remember, whether you’re analysing financial data, presenting research findings, or exploring customer behaviour, a well-designed visualization can make all the difference.
While this blog post has focused on choosing the right chart type for effective communication, data visualization is just one aspect of a robust Business Intelligence (BI) strategy. At CCS Technologies, we leverage powerful tools like Microsoft Power BI to go beyond simple charts and delve deeper into your data. Power BI empowers you to:
Transform raw data into interactive dashboards and reports.
Uncover hidden patterns and trends with advanced analytics.
Gain real-time insights to support data-driven decision making.
Collaborate and share insights across your organization.
Our team of BI experts can help you implement a customized Power BI solution that unlocks the full potential of your data and empowers you to make smarter business decisions. Contact us today to learn more about our BI services.